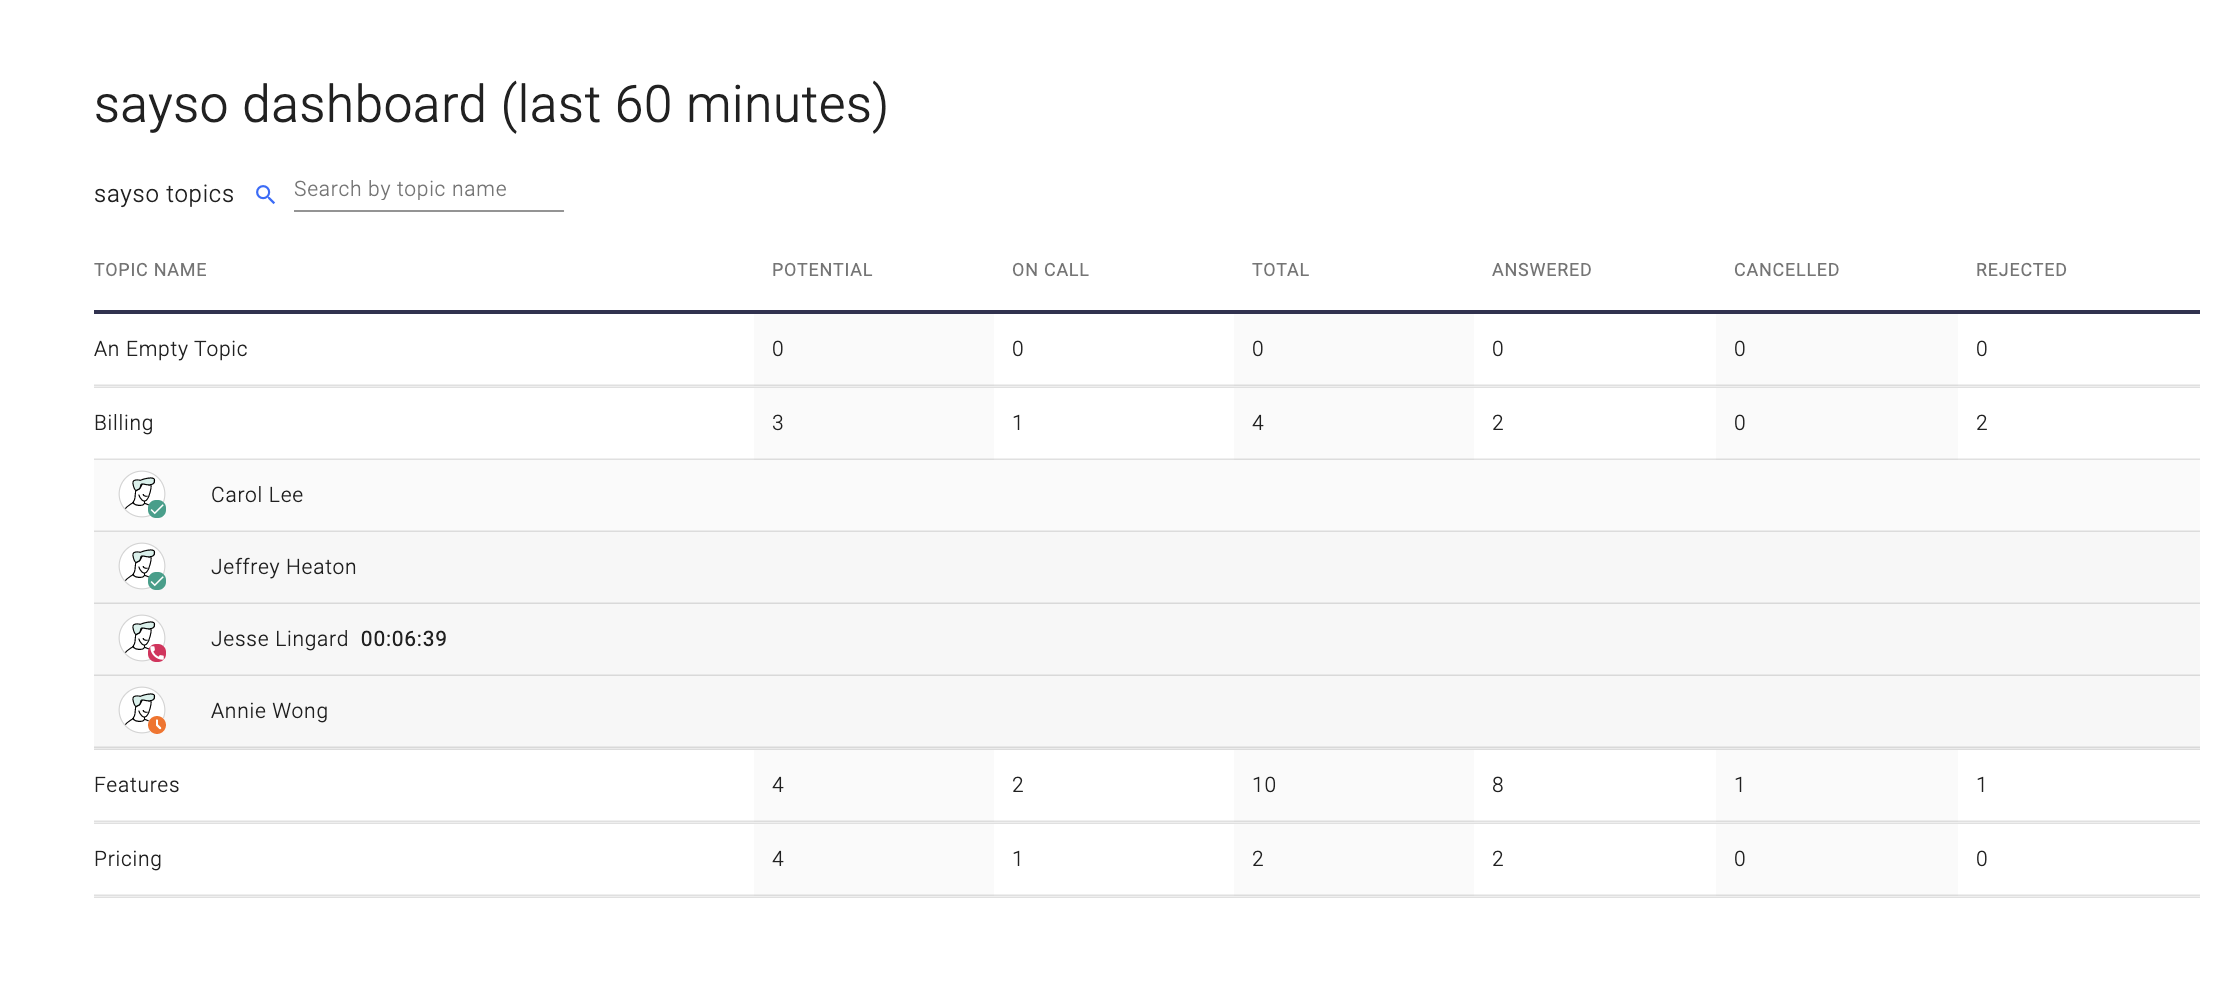
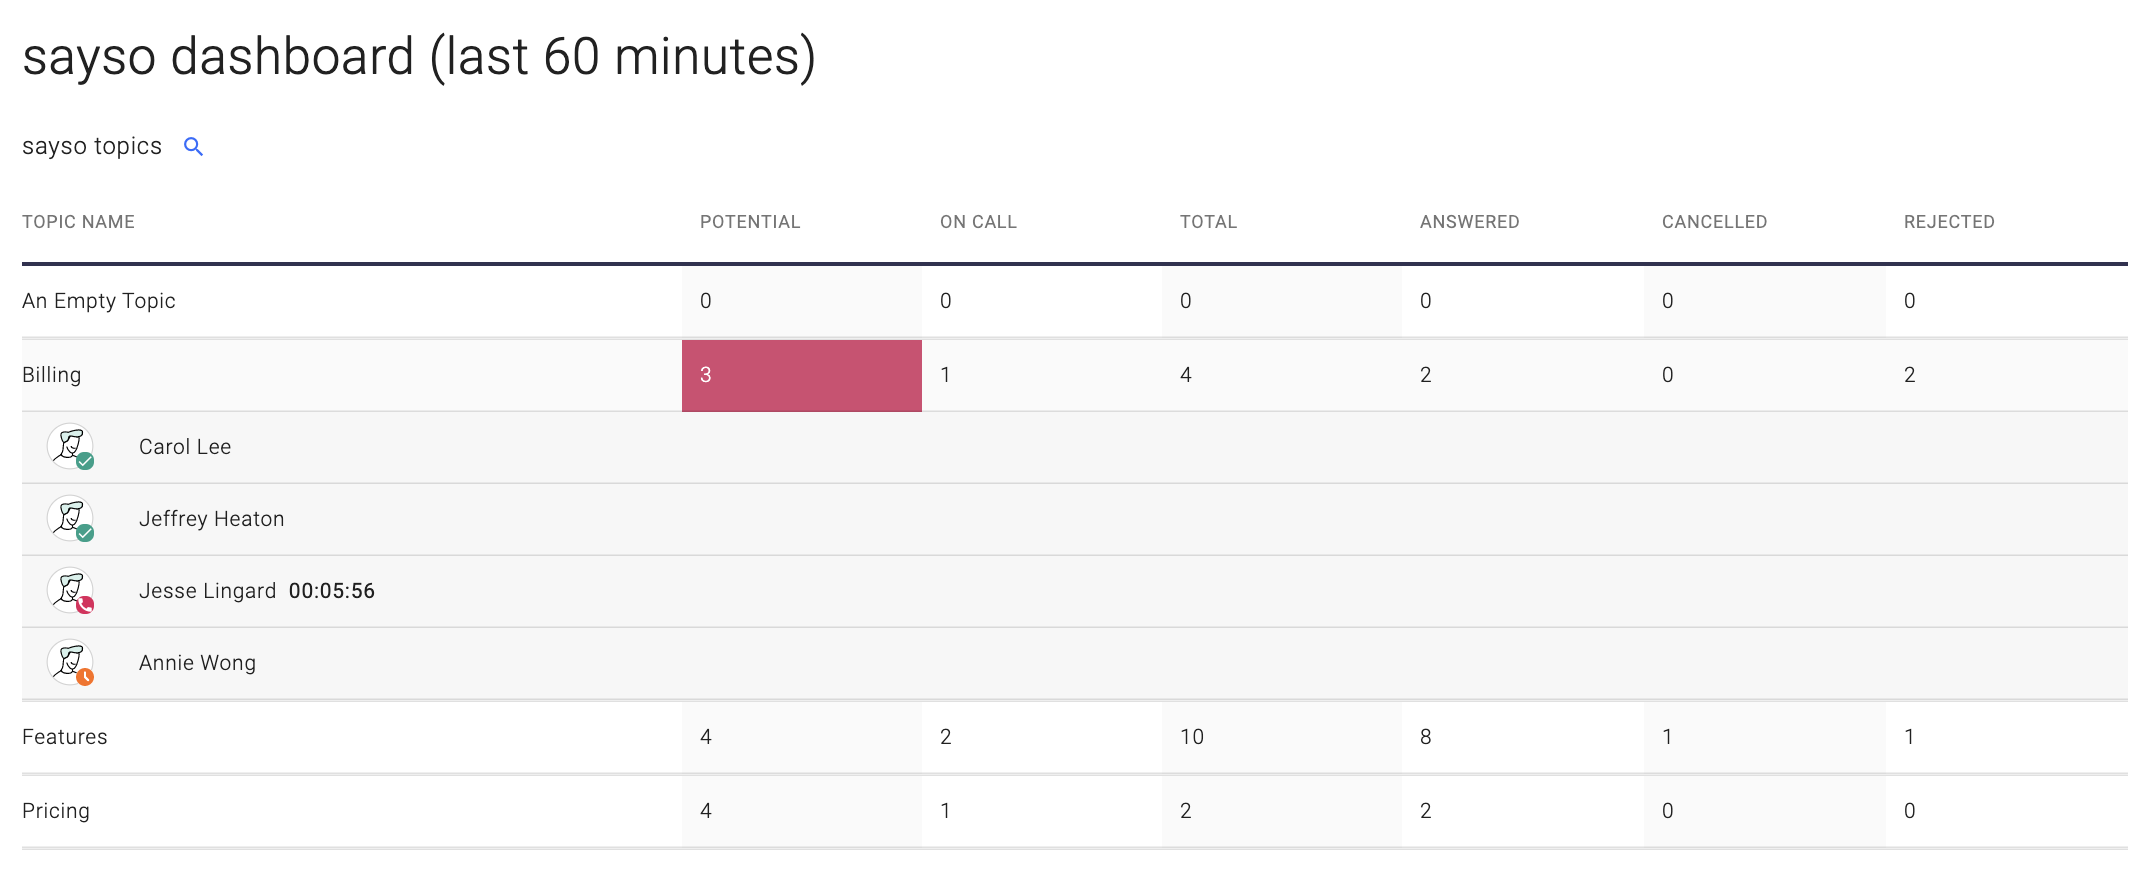
We’re happy to announce a new tool for sayso users: the sayso manager dashboard. It provides sales and support teams a way to track demand and ensure each topic is properly staffed. Existing OnSIP customers should recognize the interface instantly—it’s almost identical to the Queue Dashboard. This time around, the expandable sections are sayso topics instead of queues.
 The dashboard updates in real-time on a rolling 60-minute basis. At any given moment you can see the following stats for each topic during the past hour:
- Potential: A website visitor has clicked on the sayso button and the widget popped up, but they haven’t yet clicked on a rep to start a call. This will register for all topics available on that particular page. The point is to give managers a rough idea of demand so that they can tell if the topic has enough reps available.
- On Call: Calls in progress
- Answered: Successful connections
- Canceled: Calls started and then canceled by the site visitor before the rep picks up
- Rejected: Calls initiated but not answered
With the exception of Potential, all columns refer to actual calls made or attempted for that sayso topic.

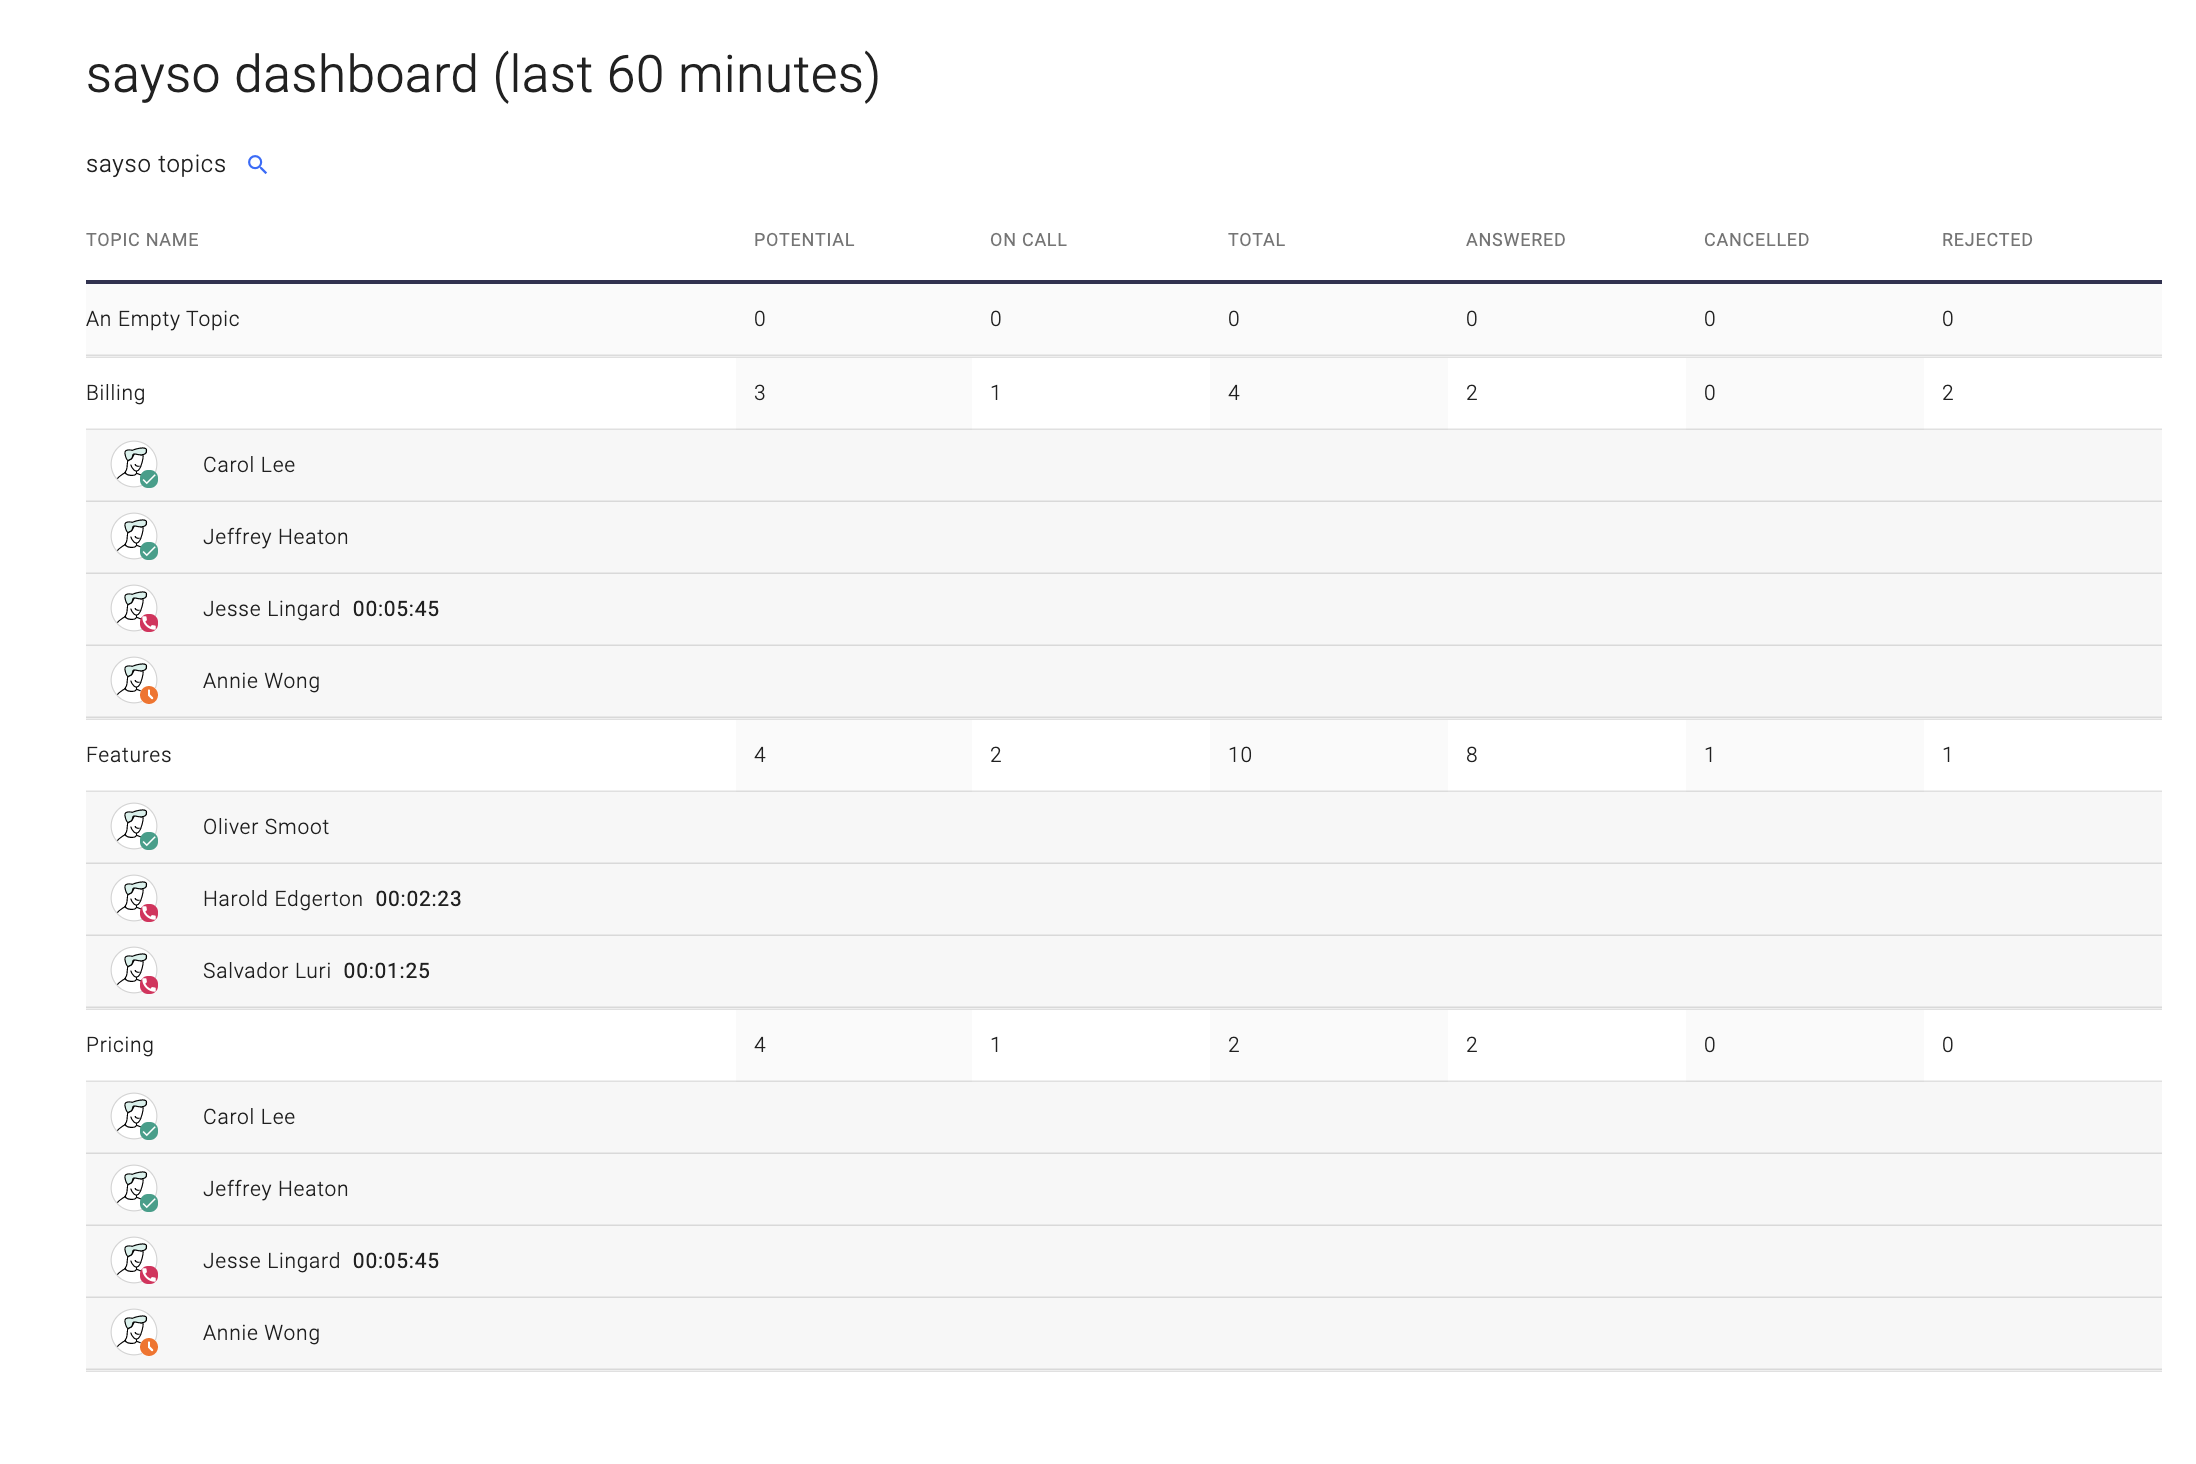
For the reps in each topic, you can see their Global Availability status in their icon, as well as a call timer if they’re currently on a call. Note: This timer refers to any call they are on, not necessarily a call from that topic or even sayso at all.
Reps are listed under each topic they’re assigned to, so you’ll likely see them appear on the dashboard more than once:
 We introduced the sayso analytics dashboard at the end of 2019, and we hope you’ve found it insightful! That dashboard is more useful for marketing and lead generation teams. This manager dashboard is geared toward sales and support managers with its rolling real-time updates. Hopefully, it helps you better understand your sayso demand and distribution!

